Your team hasn’t booked a meeting in weeks and you’re starting to feel the pressure.
Your VP 1:1 rolls around and the message is clear: fix it now or miss quota.
You assume it’s an activity problem, so you block 30 minutes a day for more dials.
Two weeks later? Still no meetings.
Why? It wasn’t a volume issue. The connect rate was garbage.
Most managers waste their team’s time by solving the wrong problem. Great managers use metrics to pinpoint the exact part of the sales process that is broken.
That’s why Mark Kosoglow built a simple, no-fluff metrics dashboard at Outreach to expose the real root-cause problems in the sales funnel.
So today we’ll break down:
- Mark’s 3 Core Principles When Reading Metrics
- Identify The Biggest Problem with L1 Metrics
- Diagnose The Root Cause with L2 Metrics
Let’s dive in.
If you like this, don't forget to sign up for the Sales Management Operating System course before the $100 discount ends (TONIGHT)
Part 1: Mark’s 3 Core Principles When Reading Metrics
Your team is struggling to book meetings, you open the dashboard, and all you see is a bunch of numbers.
Is it an activity problem? Messaging? Timing?
Without a clear way to read and prioritize the metrics, there are a million problems you could fix.
Here are the 3 principles Mark uses to diagnose the exact problem to solve in your sales funnel.
1. L1 metrics show the result, L2 metrics show the cause. Let’s say meetings booked (L1) are down. When we drill down into meetings booked, we notice that connect rates (L2) are low. So you’d likely advise your AEs to try calling at different times throughout the day.
2. Plot Metrics in chronological order. They should match the flow of your funnel step by step so you can diagnose issues from the top down.
3. Metrics need context and trend. Measure how they change over time (Trend) and how they stack up to goals or benchmarks (Context). We know connect rates are an issue because they dropped 10% from September to October. Your monthly goal could also be 10%, so 3% would be low.
Part 2: Identify The Biggest Problem with L1 Metrics
Now let’s make this real with the exact dashboard Mark used at Outreach.
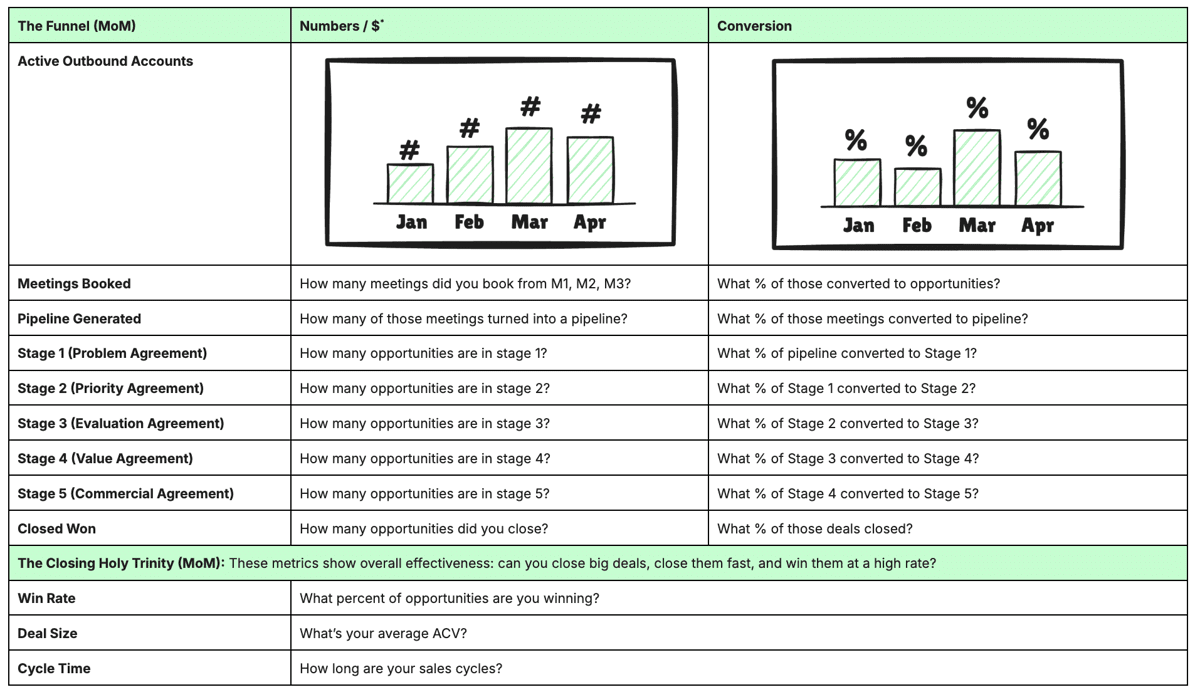
The L1 Dashboard has two parts:
Part 1: The Funnel: Map the sales funnel beginning to end so that you can see exactly where the dropoff happens in deals:
- Active Outbound Accounts
- Meetings Booked
- Pipeline Generated
- Stage 1 (Problem Agreement)
- Stage 2 (Priority Agreement)
- Stage 3 (Evaluation Agreement)
- Stage 4 (Value Agreement)
- Stage 5 (Commercial Agreement)
Part 2: The Closing Holy Trinity: This shows you how effectively your team moves deals through your sales process.
- Win Rate
- Deal Size
- Cycle Time
You want to have two columns for each: one showing counting stats ($ or #) and another showing conversion (%).
(Pro tip ask your RevOps team to make this dashboard toggle-able between $ and #)
Now read your L1 dashboard. The moment an L1 metric is down month-over-month, that’s when you go to your L2 dashboard to diagnose the problem.
Part 3: Diagnose Root Cause Issue with an L2 Metrics Dashboard
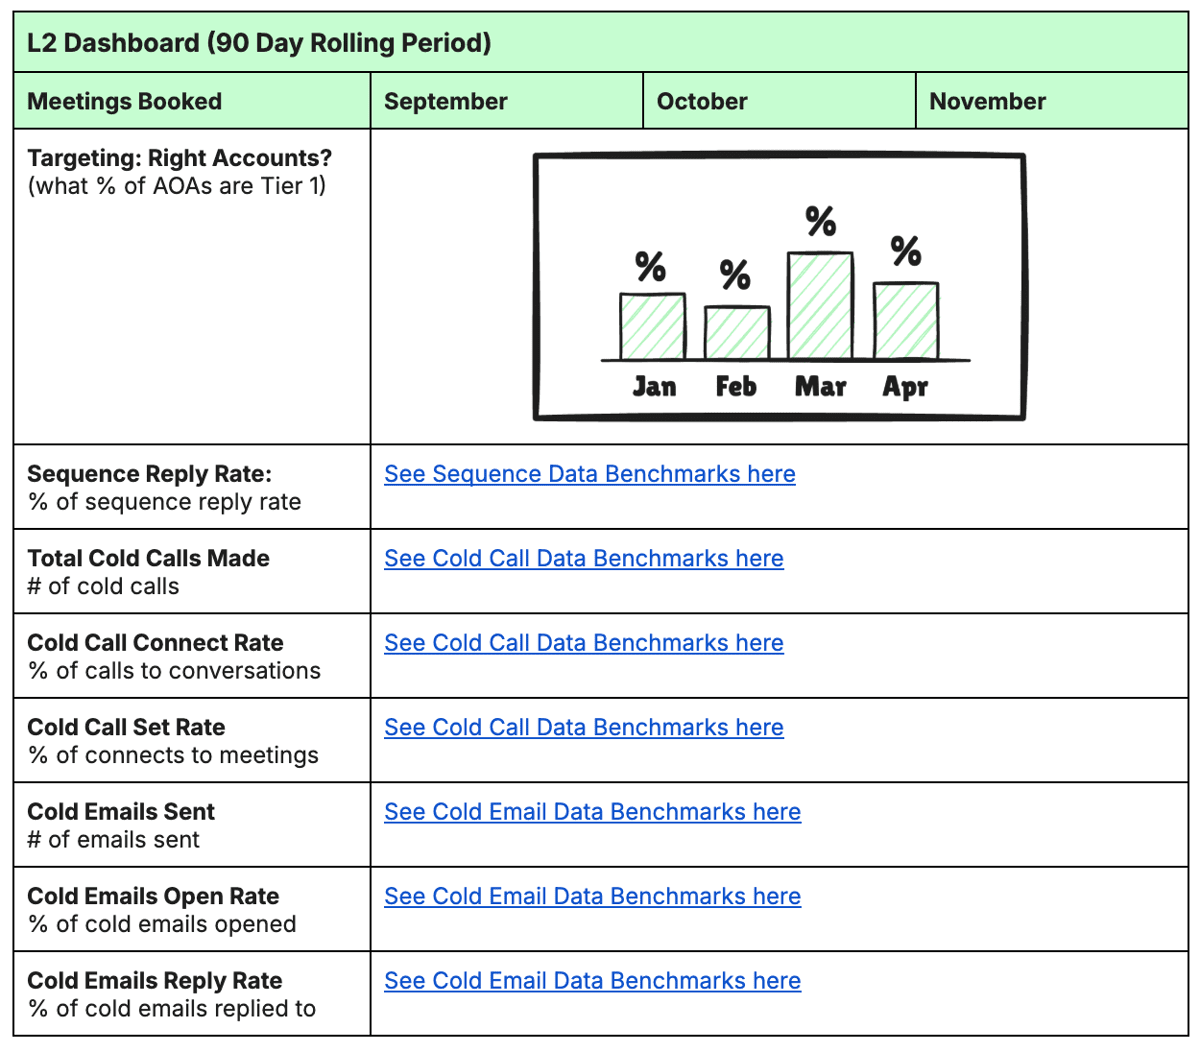
Here’s how you use L2 metrics to diagnose what’s wrong in an L1 metric:
- Stack rank L2 metrics. List out the key metrics that could be causing an L1 metric to go down (from most likely to least likely).
- Stop when you find the problem. Fixing the problem at the top usually clears the issues below and prevents you from looking at a million L2 metrics forever.
For example, let’s say Meetings Booked (L1) is down, look at these L2 Metrics:
- ✅ Targeting right accounts? Let’s say most activities are on tier 1 accounts.
- ✅ Sequence reply rate? Let’s say it’s staying healthy at double-digit replies.
- ❌ Cold calls made? You find out this is down big time.
Go solve the cold calling activity issue and stop looking at L2 metrics.
Now you’re no longer guessing at what the real issue is. You’re fixing the root cause and actually booking more meetings.
And that’s a wrap, folks!
Want more? Get a one-pager that breaks down Mark’s entire metrics dashboard so you can make it your own.
And if you like what we’re covering for free with Mark here, this is just one part of Mark’s Sales Management Operating System course — which covers everything from AE prospecting, metrics, hiring, and more.
It’s literally the last sales leadership resource you’ll ever need.
Get instant access to the exact systems, rhythms, and talent frameworks Mark used to build high-performance sales teams (that no one teaches you) inside the Sales Management Operating System course.